While a bull rally correction has been anticipated, Bitcoin’s drop from its all-time high of $99,600 to $92,000 managed to wipe out a good chunk of optimism from the market. The pace of Bitcoin’s growth since the US presidential elections in November led many to expect BTC to break through the coveted $100,000 mark relatively quickly and enter into a full-blown bull market by year’s end.
Previous CryptoSlate research analyzed futures funding rates, exploring how the cost of maintaining positions reflects market sentiment. Consistently high volume-weighted and open interest-weighted funding rates mirrored the market’s optimism and showed that the rally was mostly driven by derivatives trading.
However, it also showed a significant danger of the market overheating, as elevated funding rates signal excessive leverage that creates a fragile market environment. Periods of high funding rates often precede sharp corrections, as overextended traders are forced to exit positions.
The extent of this leverage can be seen through the estimated leverage ratio (ELR). ELR is calculated by dividing the open interest in derivatives markets by Bitcoin’s total exchange reserves. A rising ELR indicates that more leverage is utilized relative to the available Bitcoin, signaling heightened speculation.
The ELR also provides a window into how aggressive traders are in taking leveraged positions and how much of the market is driven by derivatives rather than spot activity. Since the beginning of September, the ELR has grown significantly, following Bitcoin’s rally from $65,000 to $98,000. This shows that traders were riding the bullish momentum and deploying leverage along the way, amplifying the upward price action we’ve seen in the past three months.
However, in the last few days of November, the ELR began to decline even as Bitcoin’s price remained near or at its all-time high. This divergence is particularly important when analyzing the market, as it indicates a phase of deleveraging or risk reduction.
Traders may have started unwinding their leveraged positions to secure profits or avoid liquidation risk in an increasingly volatile environment. The decline in ELR indicates that leveraged activity was scaling back, reducing the speculative pressure that had driven the rally.
Given the market’s current sensitivity, this deleveraging couldn’t go unnoticed, pushing BTC further down to $92,000.
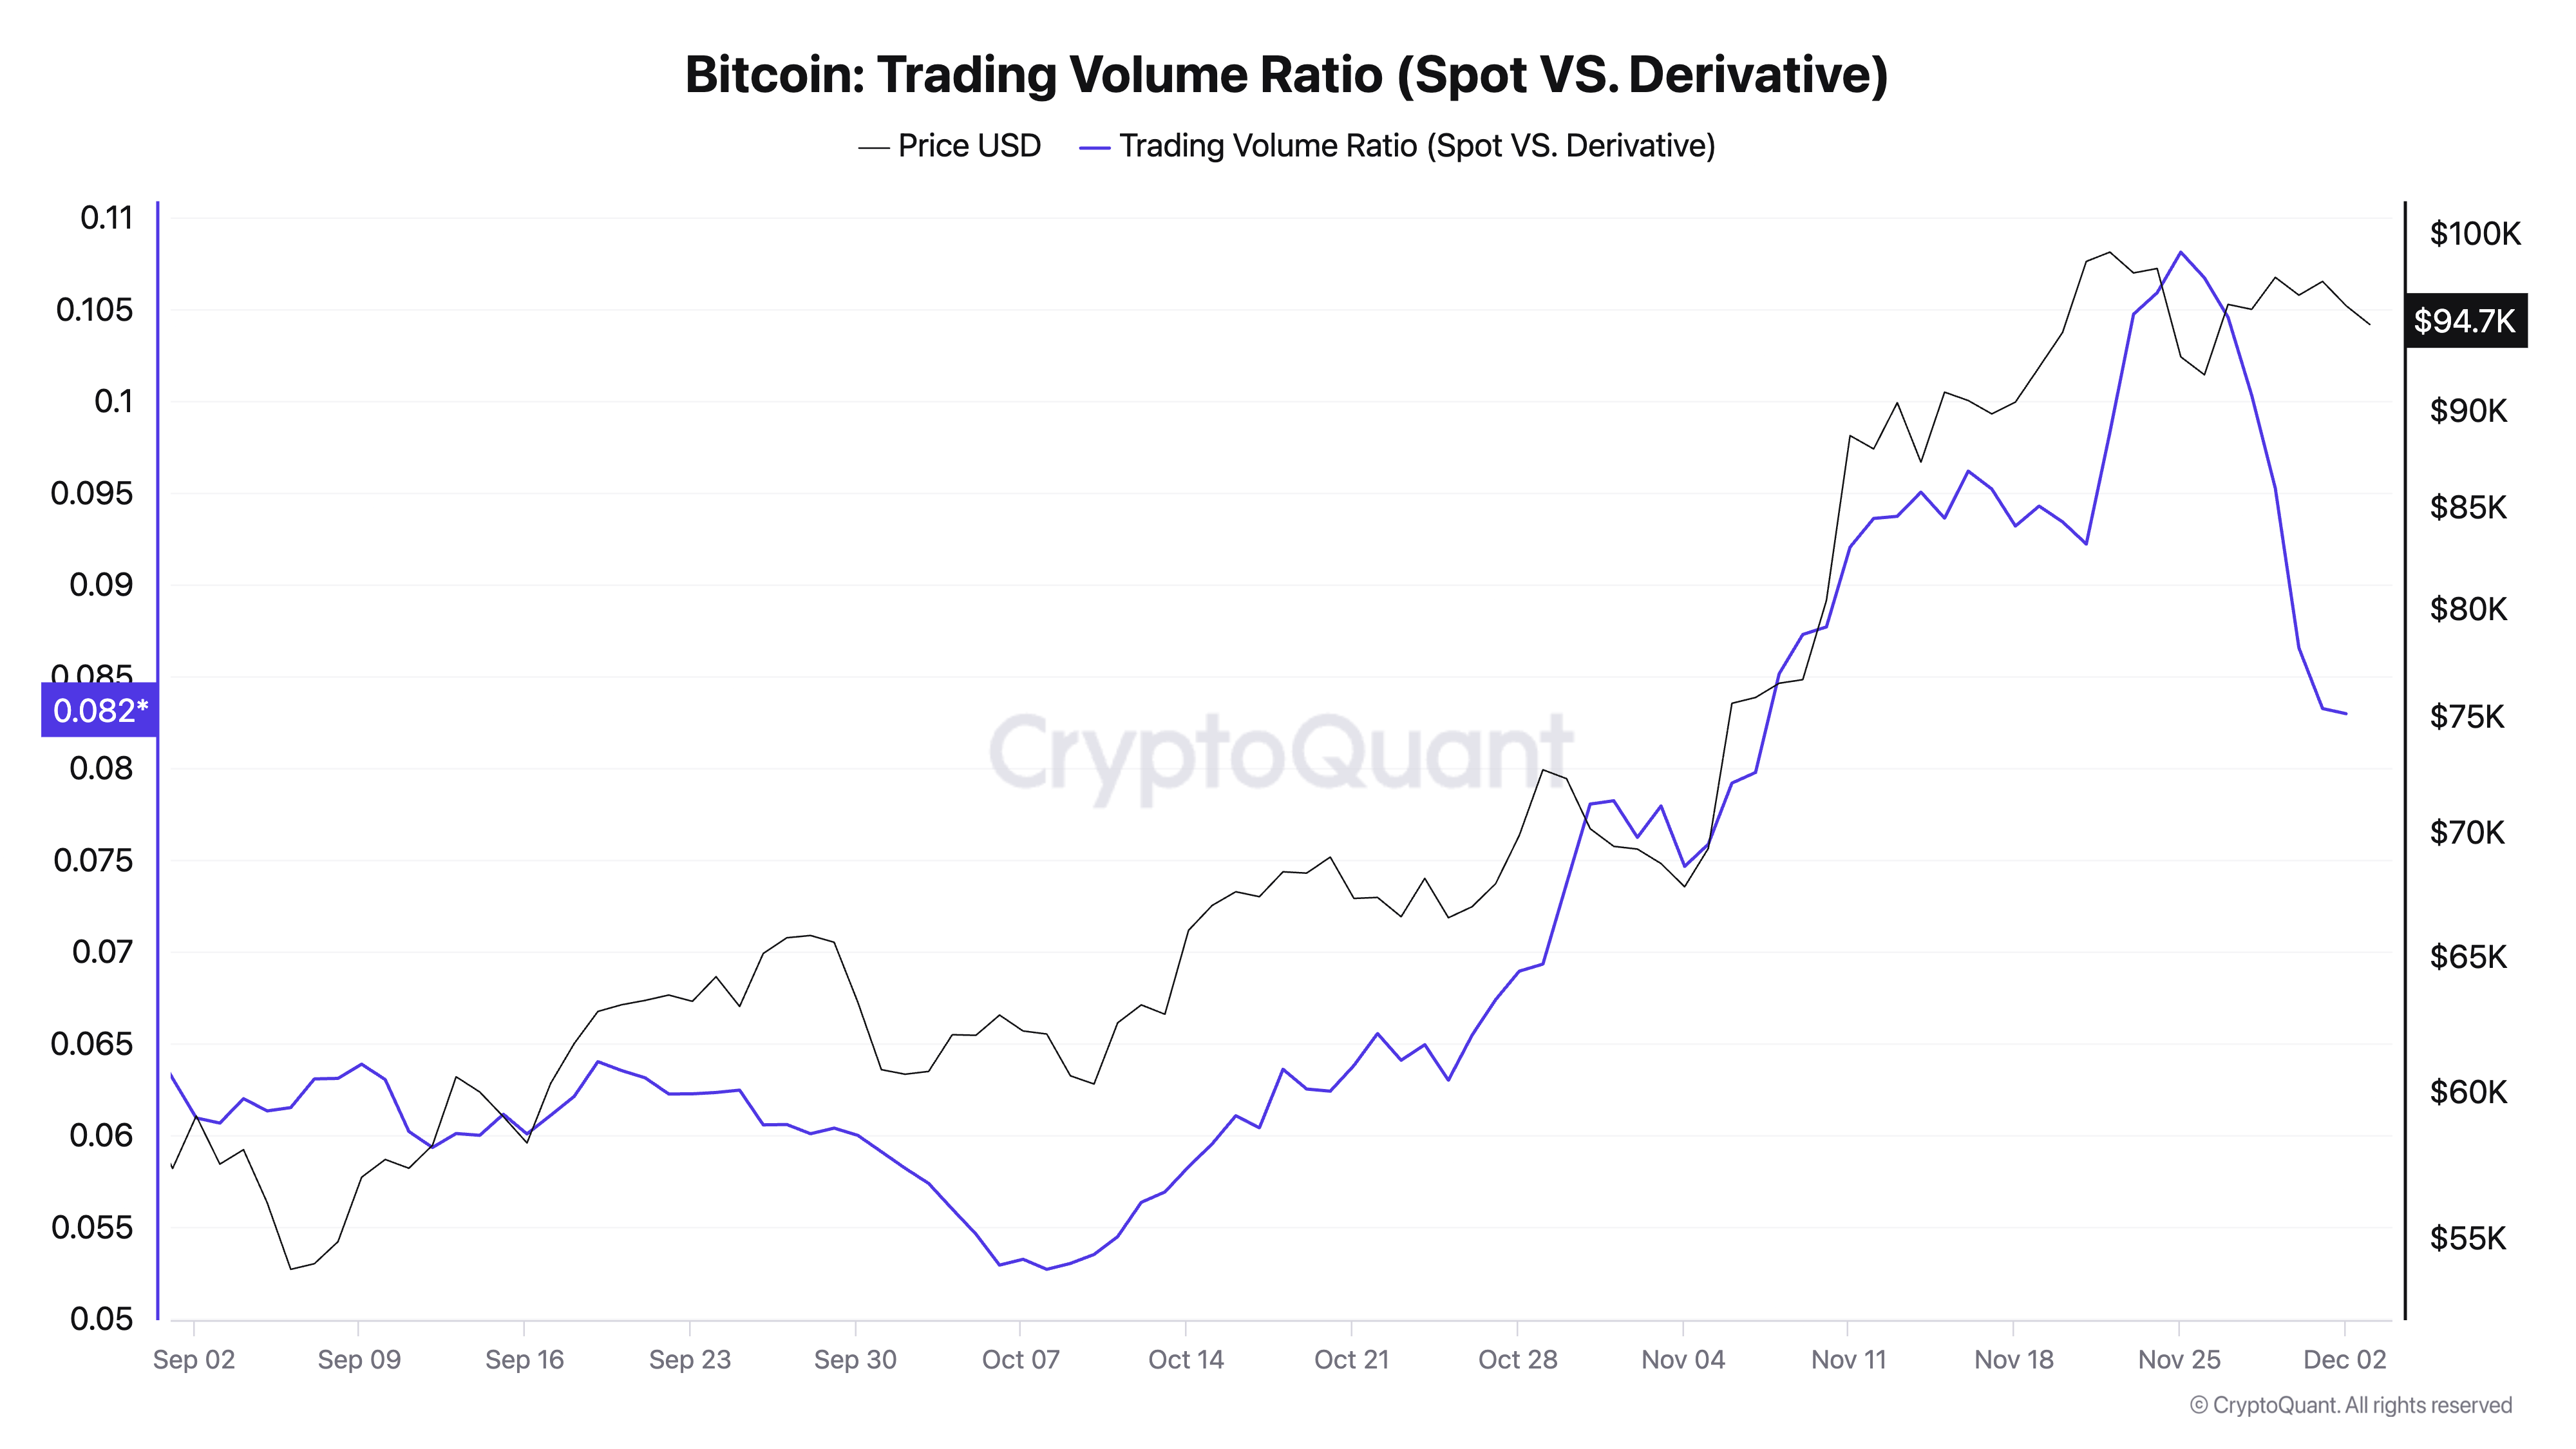
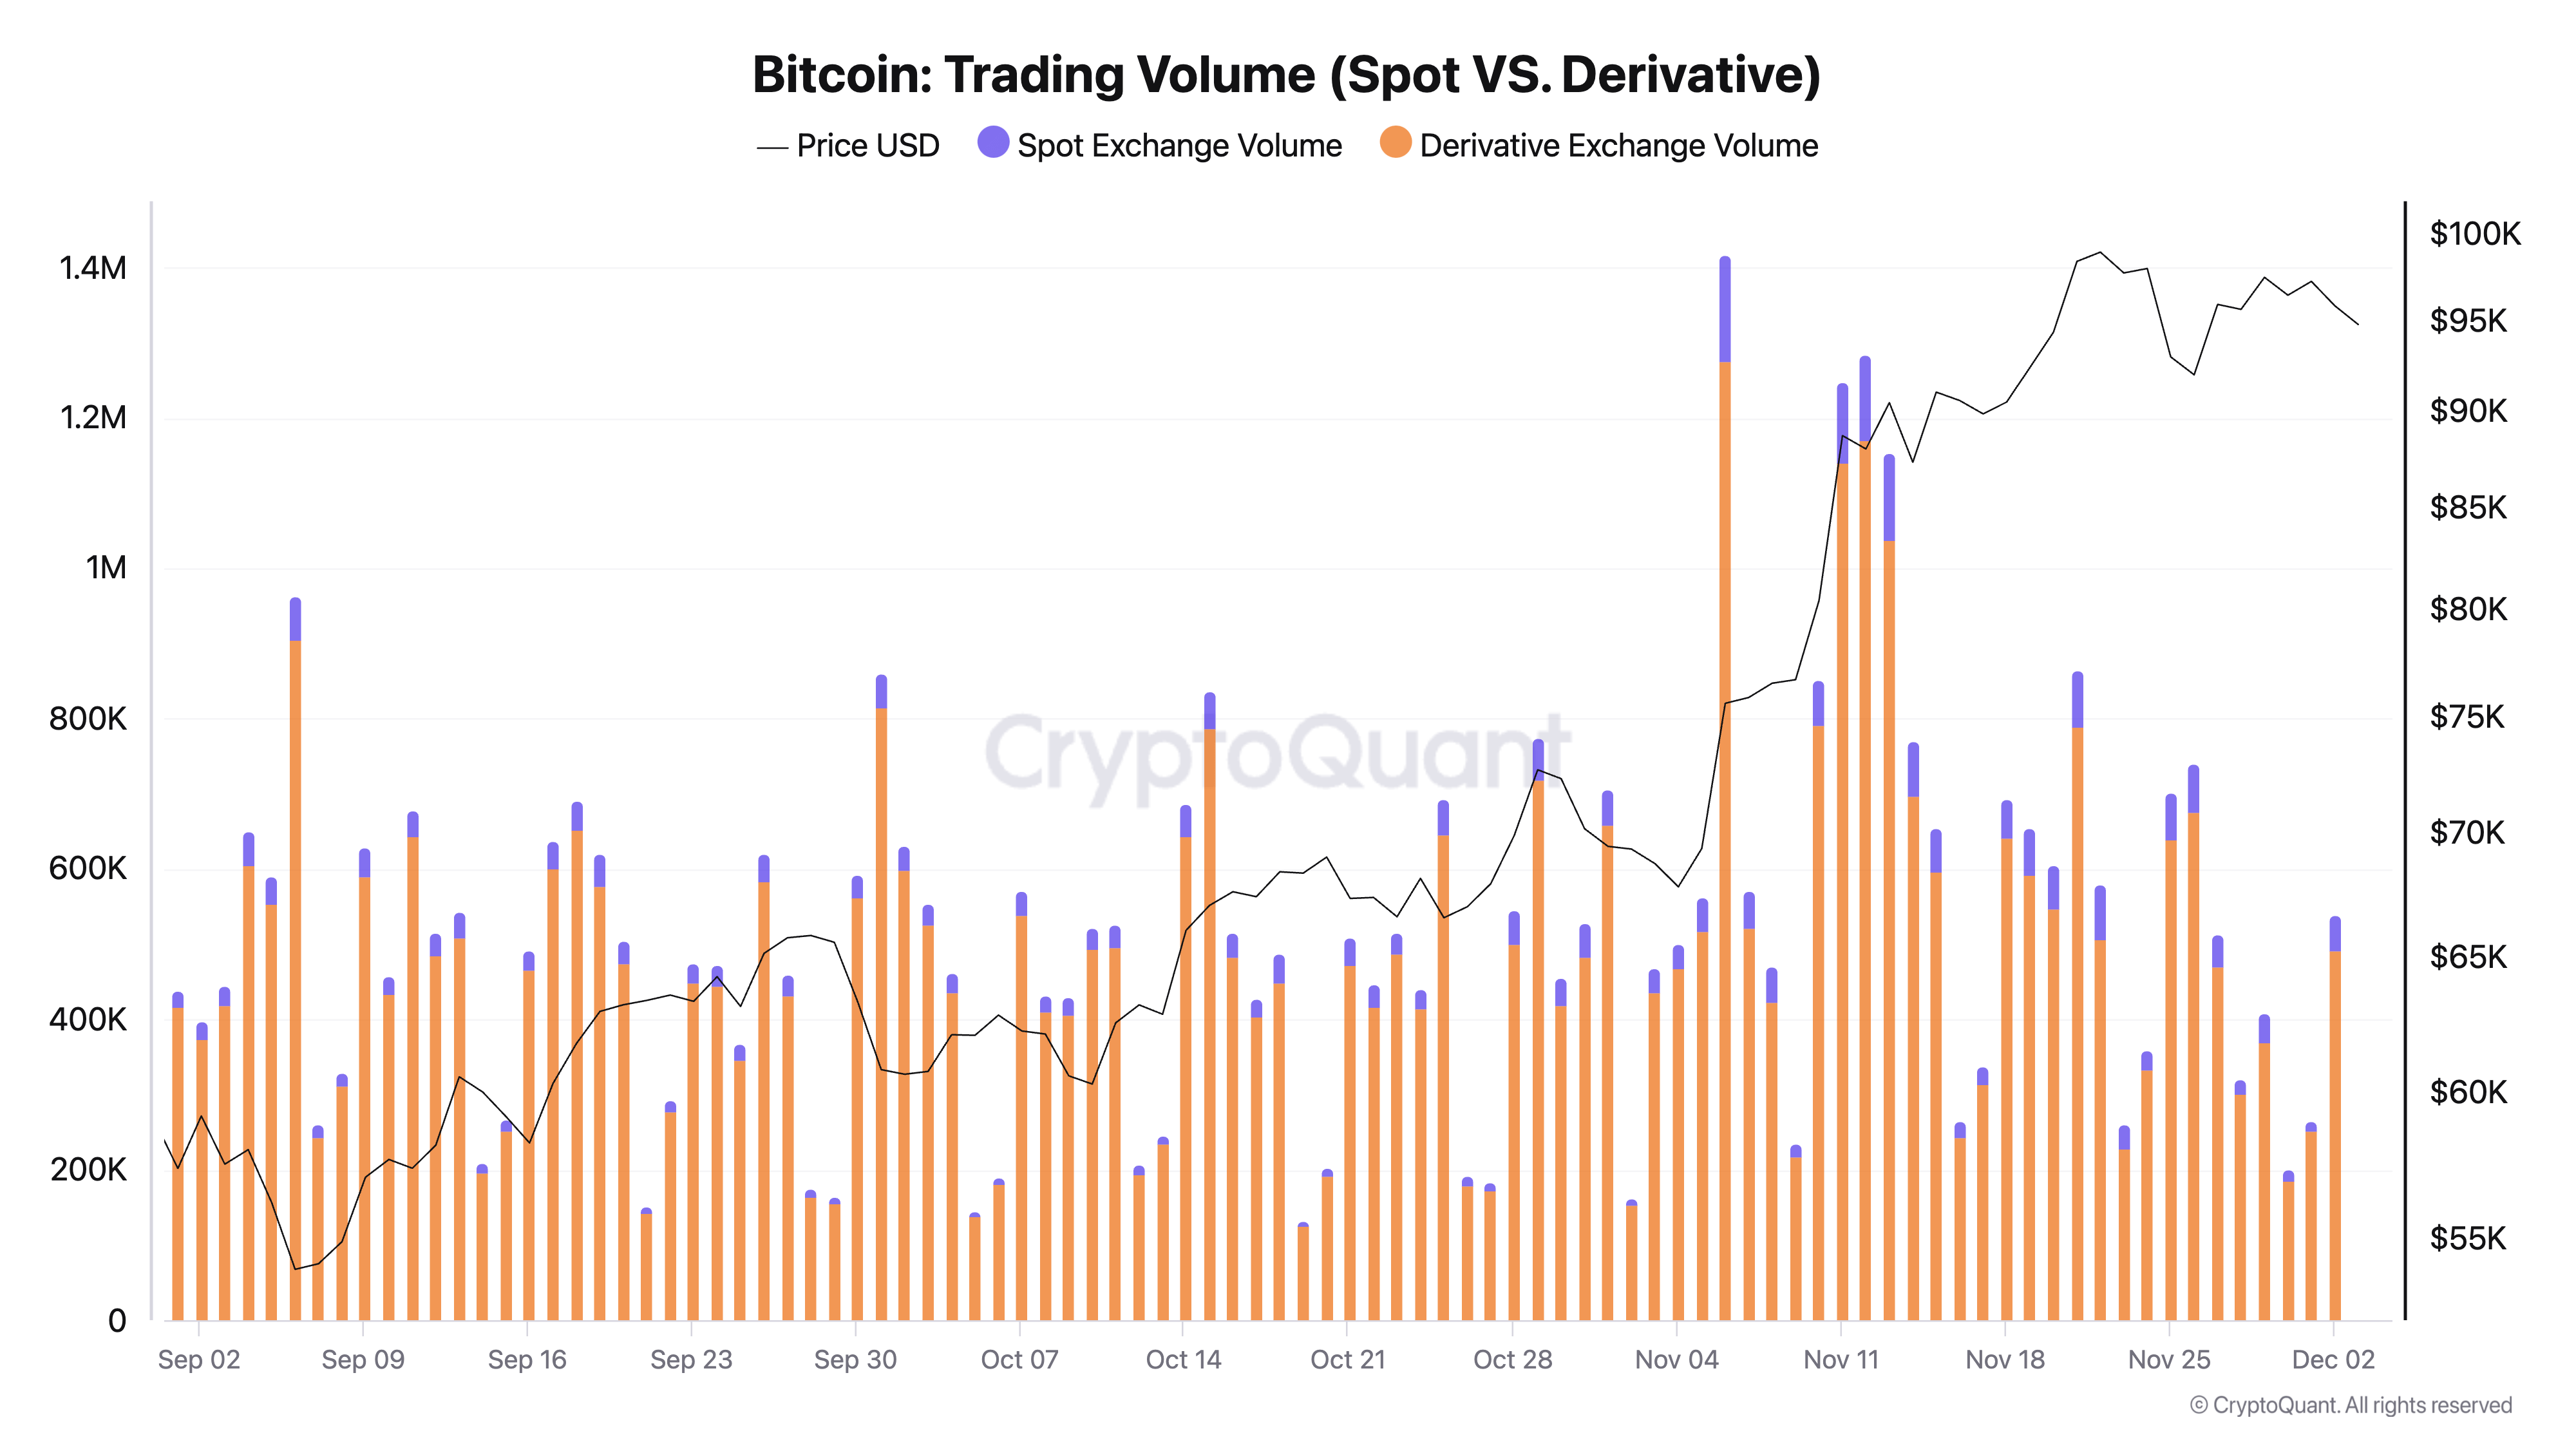
We know that deleveraging in the derivatives market caused this drop by looking at the ratio between spot and derivatives trading volume. Derivatives have consistently dwarfed spot trading volume, showing just how much speculative activity influences price.
In November, the trading volume ratio between spot and derivatives markets remained low, signaling that most activity was concentrated in derivatives rather than spot markets. As the price peaked, the derivative trading volume spiked even further, while spot volume showed less dramatic growth. This indicates that the price rally was heavily influenced by leveraged traders rather than organic demand from spot buyers.

In the final days of November and the first two days of December, the derivative volume began to decline sharply, reflected in both the absolute trading volumes and the trading volume ratio. This drop in derivative activity coincided with the decline in ELR, suggesting that traders were scaling back their speculative positions.
The falling spot-to-derivative volume ratio during the rally and its slight recovery as prices stabilized near $95,000 suggests a temporary pullback in speculative fervor. However, the lower ratio overall signals that derivatives markets remain the primary driver of Bitcoin’s price movements, even during deleveraging phases.

The combination of ELR and trading volume metrics reveals the extent to which speculative activity drives Bitcoin’s price movements and how leverage can amplify both rallies and corrections. The recent decline in ELR and derivatives volume, coupled with a slight recovery in the spot-to-derivative ratio, suggests that the market is entering a period of consolidation.
If organic spot activity increases, this may provide a healthier foundation for future price moves.
The post Massive deleveraging stopped Bitcoin from breaking through $100k appeared first on CryptoSlate.

